
This article was made possible through the generous support of our voluntary subscribers. If you would like to see more articles like this one, please support FasterSkier with a voluntary subscription.
I’ve been curious for a long time about participation trends in cross-country skiing and what direction the data might point. Ideally, I’d like to see longitudinal data over 10-20 years, but that kind of dataset doesn’t appear to be publicly available. Still, there are several metrics we can look at, participation in popular citizen races, involvement in youth programs, and USSS competitive memberships, that together may paint a picture of where the sport stands.
A 2021 article in FasterSkier noted that the Minnesota Youth Ski League had over 4,000 participants, suggesting growth and enthusiasm at the grassroots level. Yet, that growth doesn’t seem to be carrying over into USSS racing participation. At least from the perspective that there about two times as many youth skiing in the Minnesota Youth Ski program than there are junior members in USSS from the U16-U20 age groups.

The table I compiled, from the USSS website for the 2024–2025 season, includes membership numbers for U16, U18, and U20 competitive skiers. These figures represent registered members, not necessarily those who actually raced. For example, in the Rocky Mountain Division (RMD), there are 192 registered athletes, but actual participation in the eight Junior National Qualifiers (JNQs) ranged between 82 and 115 athletes across those three age groups.
Looking at the big picture, there are 2,119 competitive junior members nationwide in these three age groups. For comparison, the Colorado High School Mountain Bike League reports roughly 1,000 racers, while an estimated 14,000 high school mountain bikers compete nationwide. High school cross country skiing, by contrast, has around 6,500 athletes across the U.S. Clearly, other sports are attracting larger numbers. Comparing participation across sports, particularly at the high school level, can be useful context when we talk about growth, accessibility, and retention.
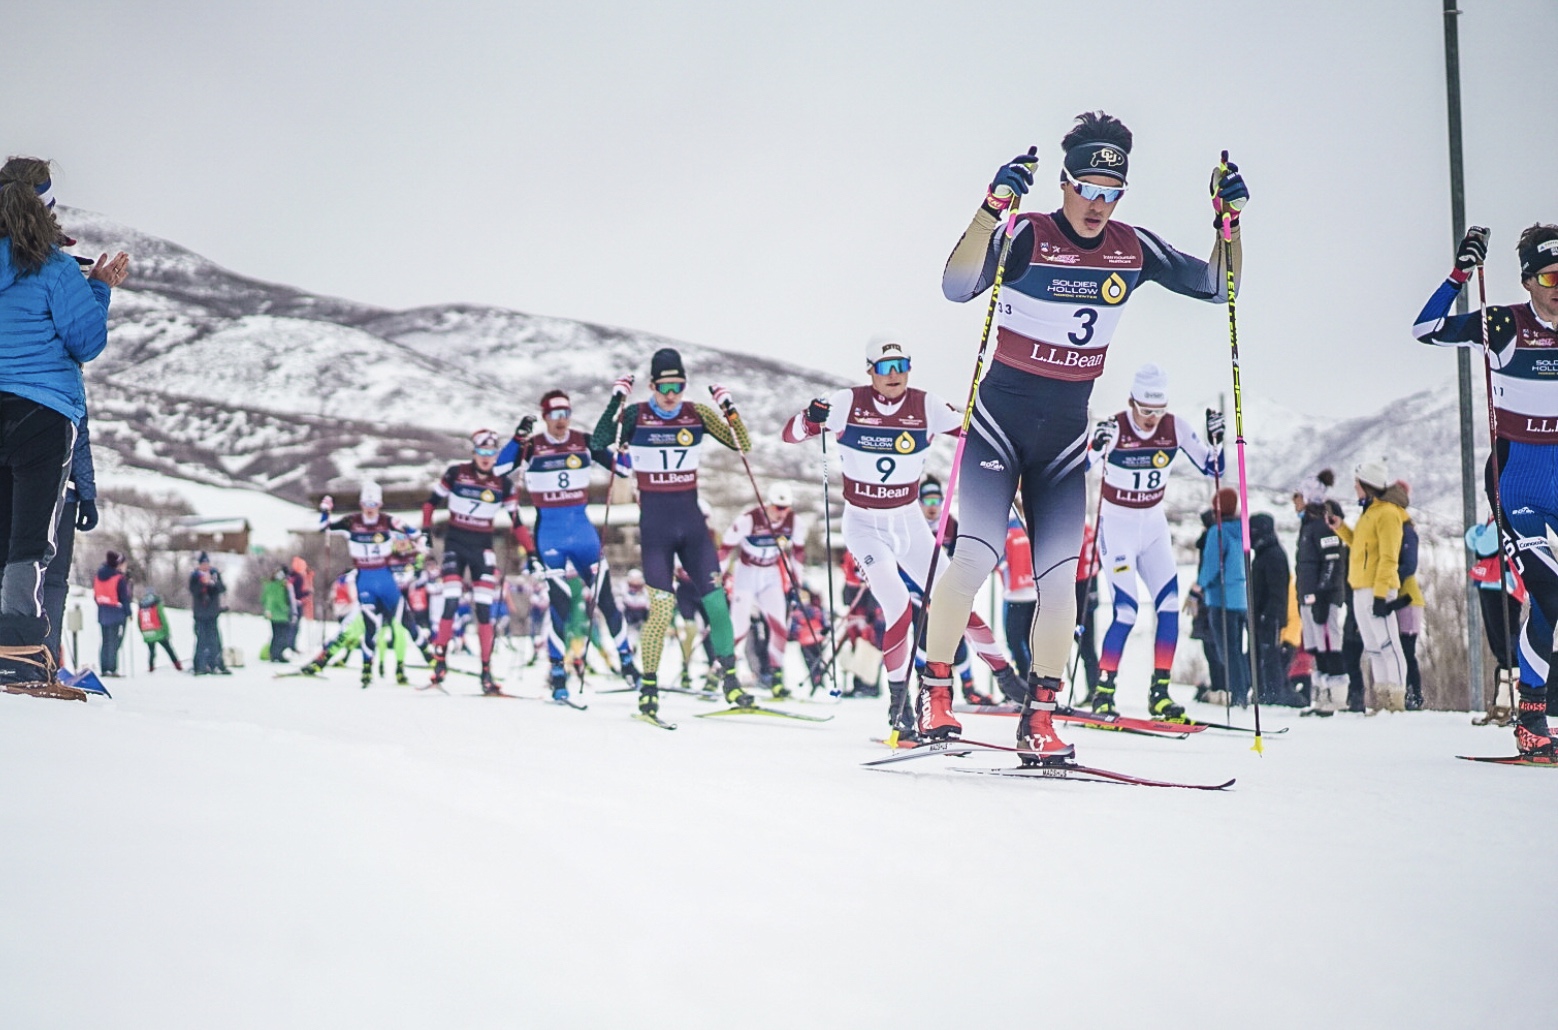
A region-by-region comparison is also revealing. The East and Central regions have by far the most licensed competitors. Junior Nationals in March of 2025 at Soldier Hollow is reported to have had 434 athletes competing, about 20% of the total registered juniors. Interestingly, Alaska, Intermountain, and New England are the regions regularly in contention for the Alaska Cup. That suggests that team performance isn’t necessarily linked to the total number of licensed athletes in a region. Within those top-performing regions, participation trends also differ: Intermountain shows a steady decline through the age groups, while Alaska and the East see participation increase as athletes move up. Note- the influx of college athletes into eastern schools probably accounts for at least some of that growth.
