Hailey Swirbul during an intensity session at a U.S. Ski Team camp in Park City, Utah, in October 2018. The same pace can cost an athlete very different amounts from one day to the next. (Photo: Matt Whitcomb)
In my last article on training zones, published on FasterSkier, I tried to describe the challenges we face when we don’t use a common language. There is a lot of talk on social media about Zone 2 training, while most of us in the cross-country ski world understand this same training intensity as Zone 1. Others challenge the use of heart rate to set zones at all. These discussions are great, because they push all of us to better explain our beliefs and how we got there.
Today I want to share why I think heart rate is, for most athletes, a useful, available indicator of cardiovascular stress, even though it doesn’t necessarily capture the complete cost of exercise. I often hear that heart rate is too variable: heat and other environmental conditions can change it; fueling, hydration and fatigue can affect it; it doesn’t stay the same at the same workload (pace or power); and it doesn’t react quickly enough during hard efforts. All of which has some truth to it!
Hannah Halvorsen (left) ski bounding in Park City, Utah, in June 2016. Heat, altitude, fueling and fatigue all change what a given pace costs, and heart rate reflects that cost. (Photo: Bryan Fish)
Cost or Pace?
But let’s break it down. For all endurance work, from easy endurance work below 72 percent of maximum heart rate up to high-intensity work at 95 percent of maximum heart rate, heart rate is an indicator of the physiological demand and strain associated with producing energy. So when it is said that we should use other metrics to implement and track training because of these variations, I say, really? Shouldn’t we train day in and day out based on how the body responds to those external conditions? The same pace, power, speed or workload can carry widely different physiological demands on any given day. So what are we trying to train: the metabolic cost, or the speed, power or pace we can maintain? I would argue both, but in very different circumstances.
I should note that while I use percentages of maximum heart rate to discuss training, that doesn’t mean percentages of maximum heart rate are the best way to determine training zones. It is not a bad method if you test for maximum heart rate, but there may be better ways to use actual performance data to set training zones.
David Norris and Scott Patterson during a set of pre-race classic intervals. Outside of heart rate and perceived effort, few training metrics get measured every day. (Photo: Tom Horrocks)
Every Metric Moves
Then there are those who say we should use lactate, heart rate variability (HRV), rating of perceived exertion (RPE), ventilation, respiratory exchange ratio (RER) and other metrics that change with improved fitness. In fact, those may be better or similar metrics. The problem is that, except for RPE, they are not typically measured daily, so coaches don’t see how much they can vary from one day to the next. Any measure requires context to understand its daily variation. Why? Because the body changes every day in response to life and training stressors.
All of these measures require context, consistent testing protocols and an understanding of their day-to-day variability to be effective. The bottom line is that we need metrics that can be measured daily to understand how athletes are responding and adapting to training. When we are doing aerobic endurance training, often described as Zone 2 and, in the ski world, as Zone 1, the oxygen cost is reasonably reflected in heart rate during exercise.
Certainly, the metabolic cost of training changes from day to day with internal and environmental factors, which can require a higher heart rate to produce the same energy output. We also see heart-rate drift during these workouts: at the same pace or power, heart rate climbs. My response is, OK, this represents an increase in internal cost, and we should definitely respond to it. No metric is perfect, but heart rate captures an important and significant part of the internal strain of training.
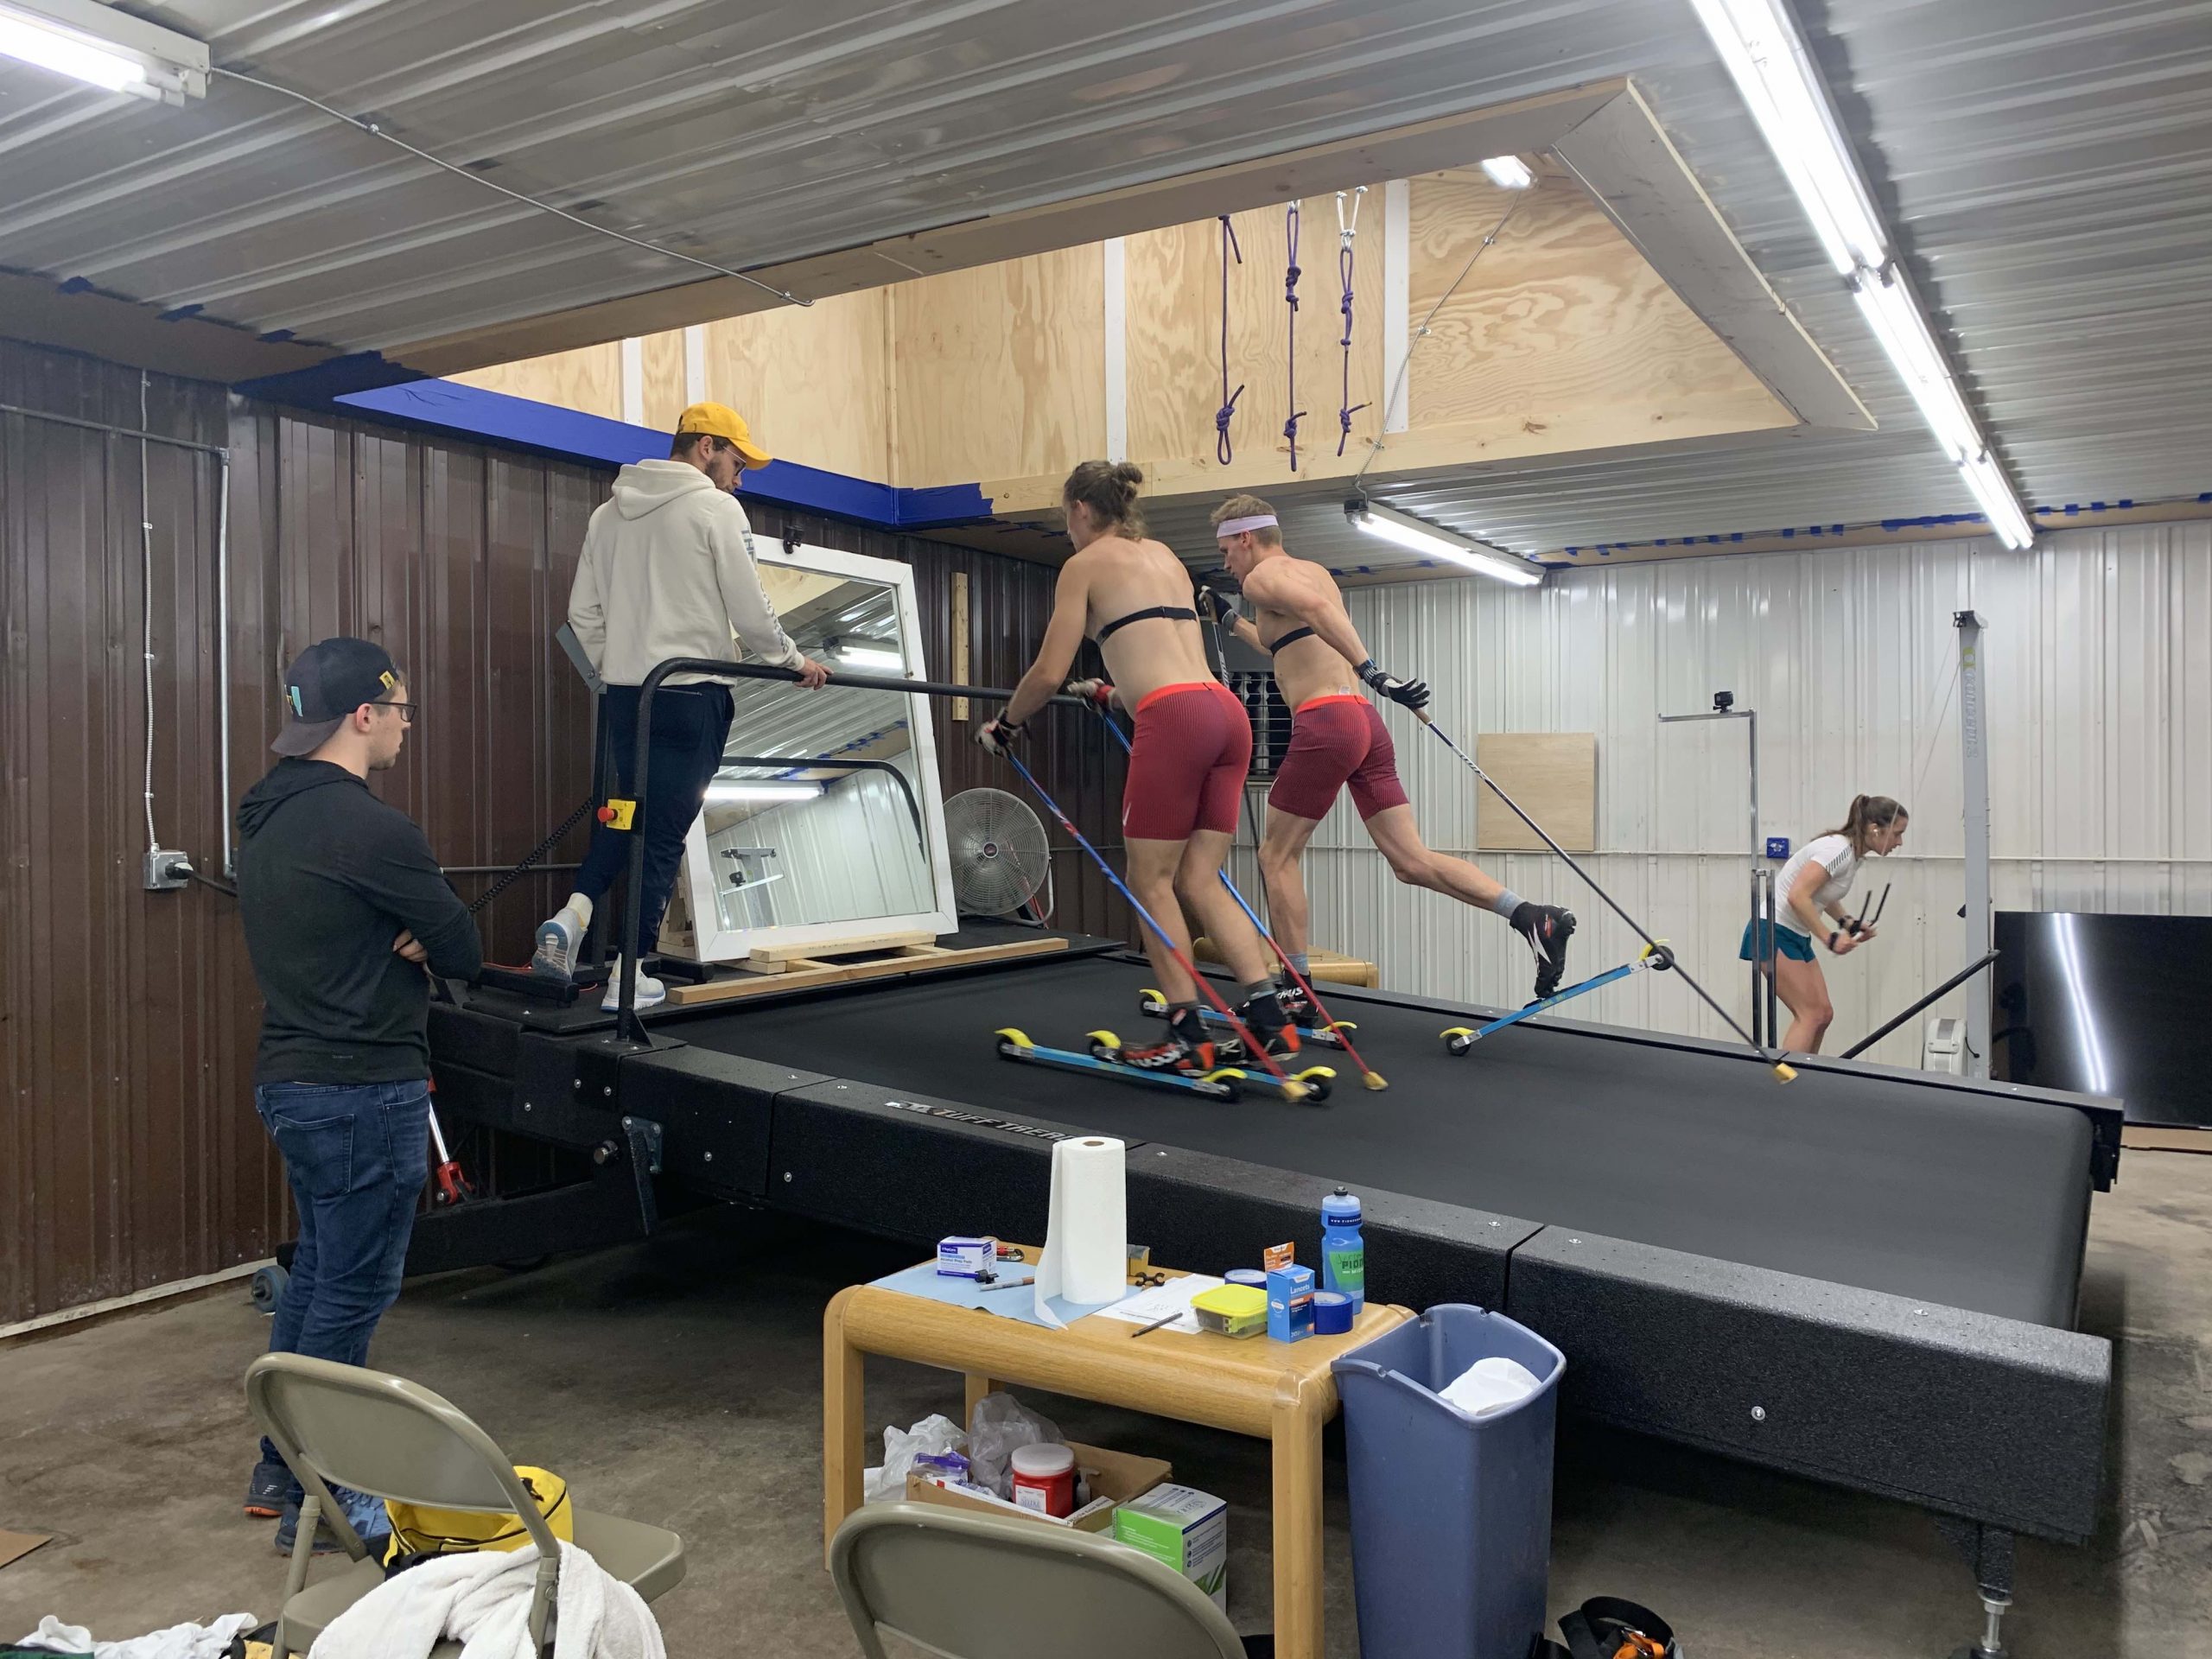
Team Birkie’s Xavier Mansfield (left) and Zak Ketterson share a rollerski treadmill in 2021 while coaches Leo Hipp and Jeremy Hecker give feedback. A lab number is a snapshot unless it is measured often enough to show its own daily variation. (Courtesy photo)
Variation You Never See
To those who say other measures (ventilation, HRV, lactate levels, respiratory exchange ratio, respiration and others) are more accurate, OK. But without seeing how those measures change from day to day, you have no idea of the variation. People use lactate to guide training, for example, and the same goes for newer measures of muscle oxygen saturation and ventilation. They often set training zones at arbitrary levels, or from equally arbitrary estimates based on a visual read of a lactate curve, then assign work based on those values. But if lactate is not measured often during daily training, you have no idea how consistent those values are, or how they vary in response to the same factors that affect heart rate. From my observations, all of those metrics vary as much as heart rate.
No matter how we cut it, none of these measures is as precise as we like to think, because the body changes and responds daily to stress and external factors. And yes, what we are after is a measure we can observe every day. So let’s recognize the facts. Heart rate represents the internal cost of work. Sure, there are daily variations. But over time, and with context, we can understand those changes.
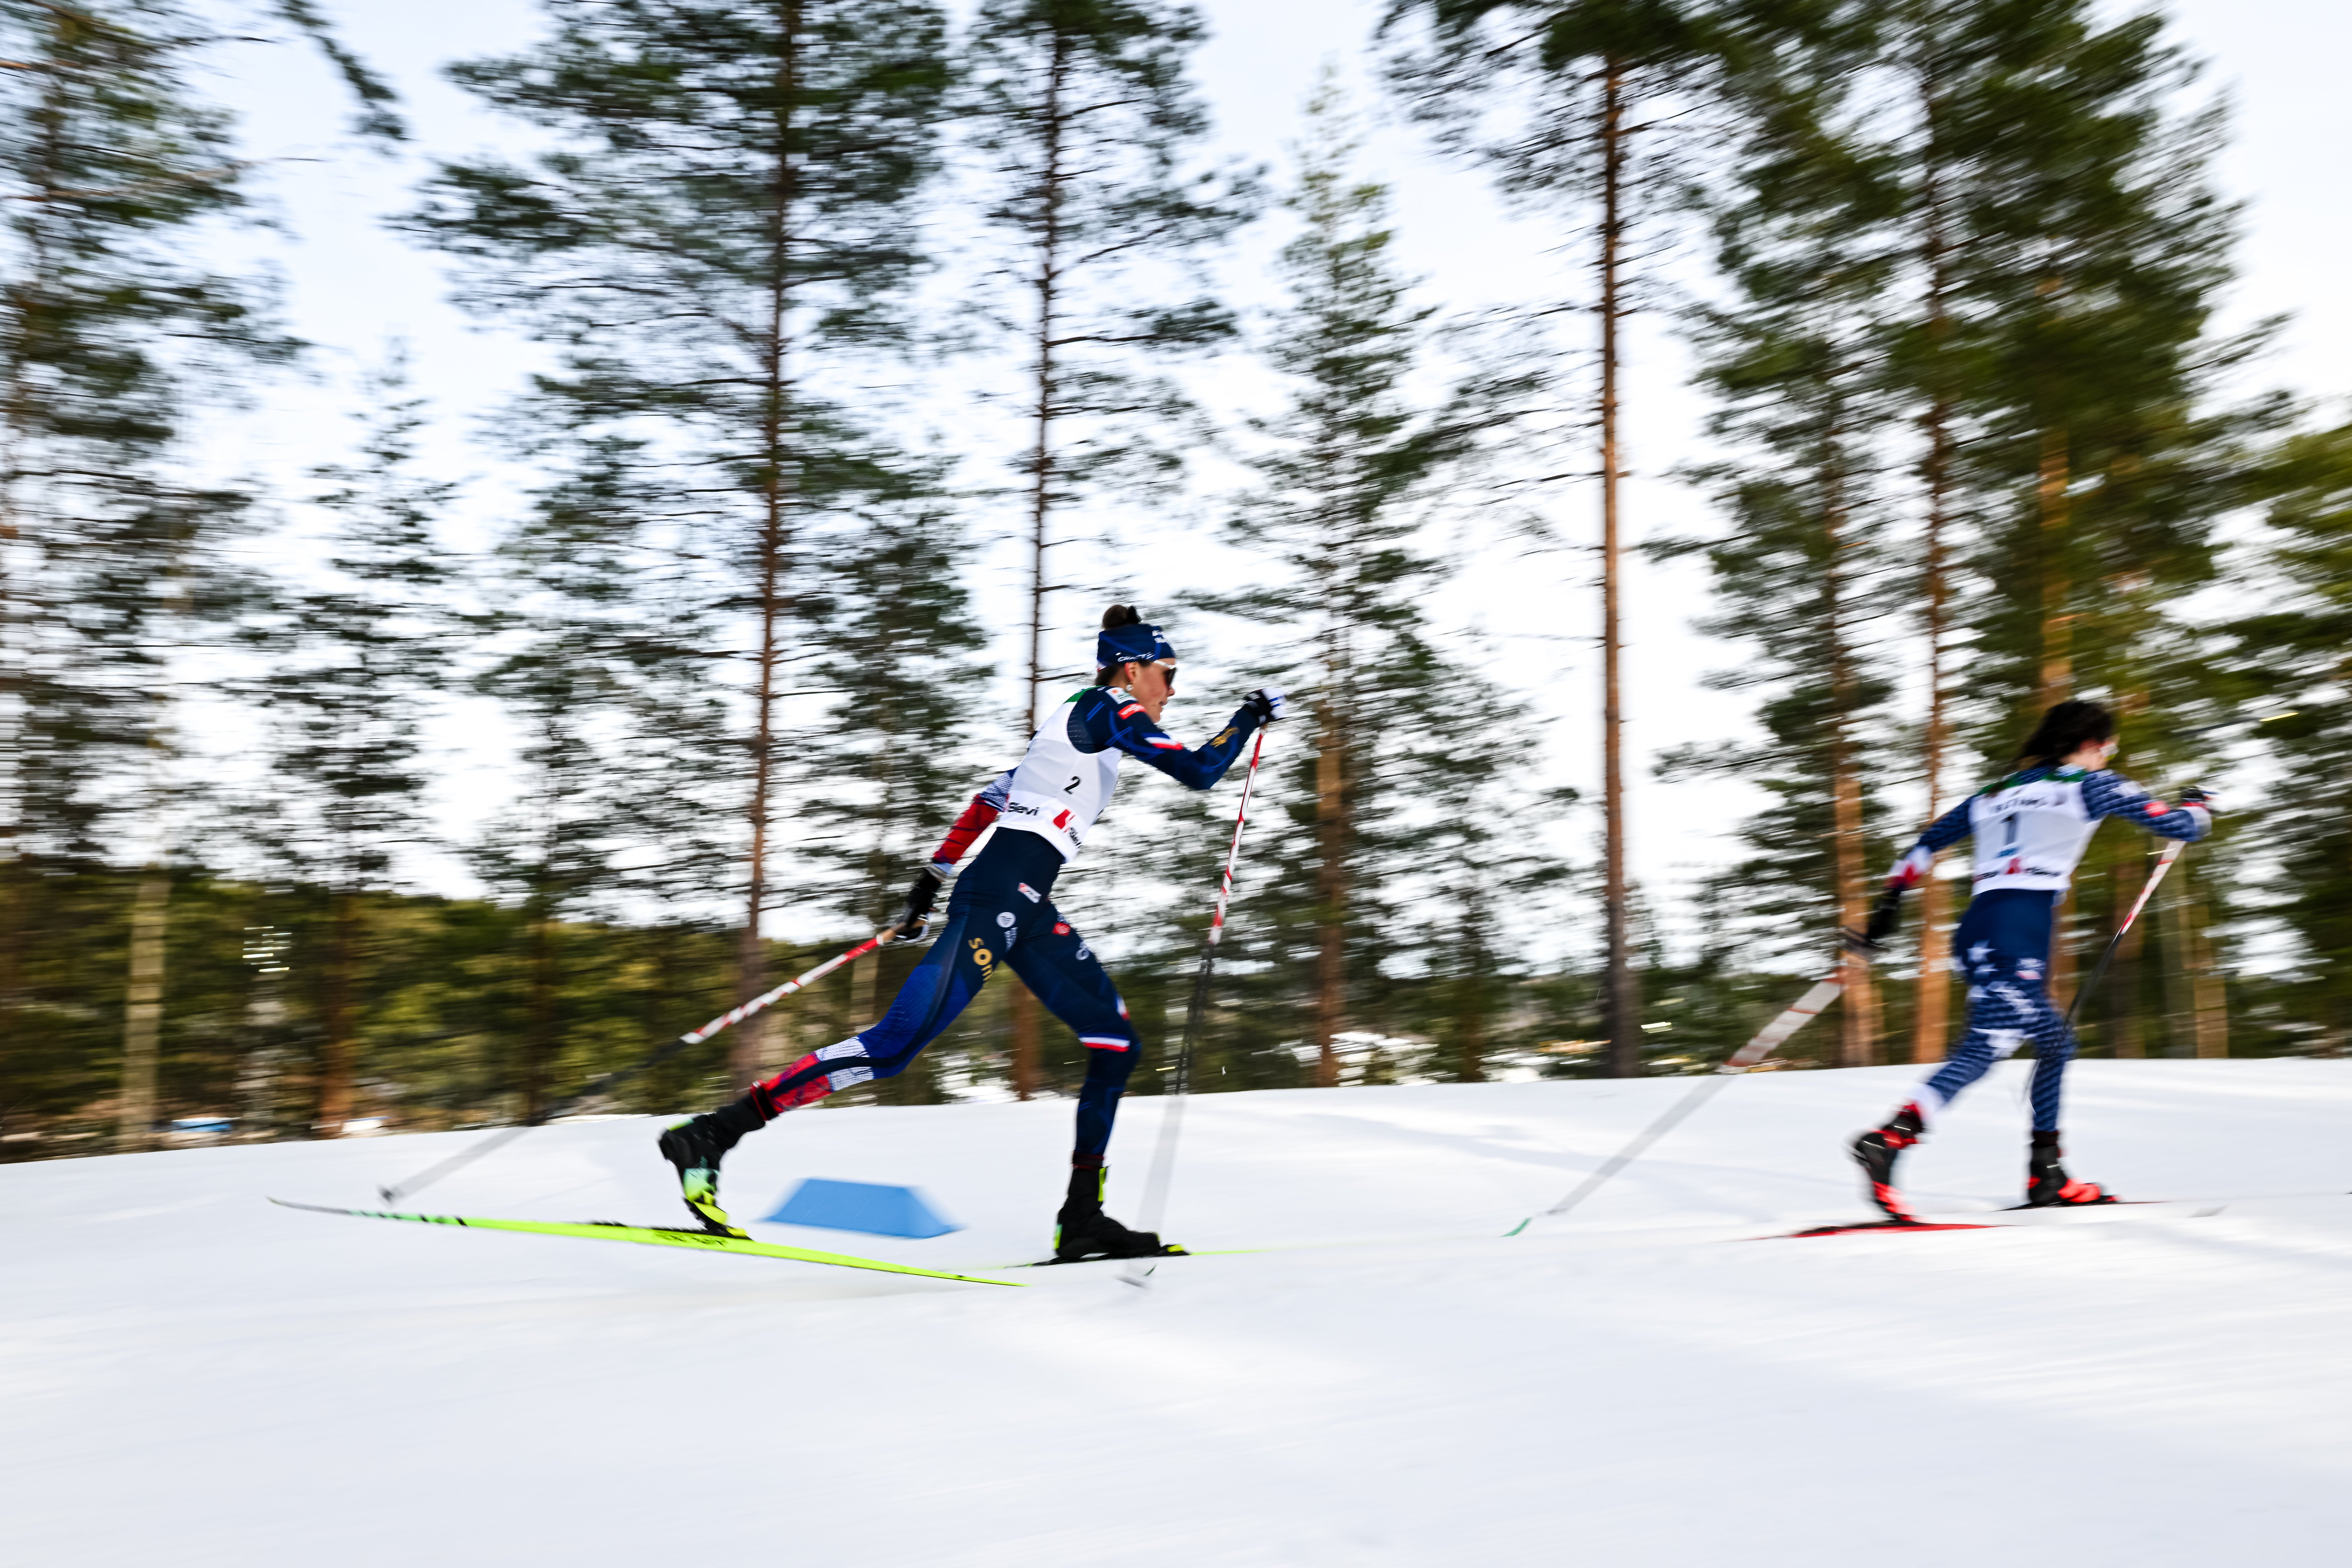
Kendall Kramer (right) in the 10 k classic at the Lahti World Cup on March 8, 2026, an interval-start race she finished in 27:40.8. Galanes puts races of 15 to 30 minutes in the middle of Zone 4. (Photo: Authamayou/NordicFocus)
How I Set Zones
So this is how I use training zones. First, I use the zones as a tool to implement and assess the effects of training on each individual. Those assessments help us determine whether the zones and the training are effective. I believe training zones provide a reasonable method that will work for most athletes and doesn’t require regular lactate or lab testing or other expensive equipment.
So what do I do? I don’t do regular lab testing, because the athletes I coach live all over the country and many don’t have access to or opportunities for it. It is also quite expensive, and most importantly, I have often seen over the years that what we learn in a lab setting doesn’t correlate with what we see in training.
I do a six-minute test, which, according to research by Véronique Billat, corresponds to the pace at which VO2max is achieved. I use the average heart rate of the last two to three minutes of the test, and I assume that to be about 94 to 95 percent of maximum heart rate. Yes, I assume! But the six-minute test also gives me a repeatable field performance and a high heart-rate observation. I use it to inform my initial estimates, not as a direct measurement of VO2max pace or maximum heart rate. The point is to establish workable ranges, observe how the athlete responds and revise them when the evidence warrants it.
I also look at racing and high-intensity workout performance. Short races of 10 to 15 minutes should be in the top range of Zone 4. Races of 15 to 30 minutes should be in the mid-range of Zone 4, and races of 45 to 60 minutes in the low to mid-levels of Zone 4.
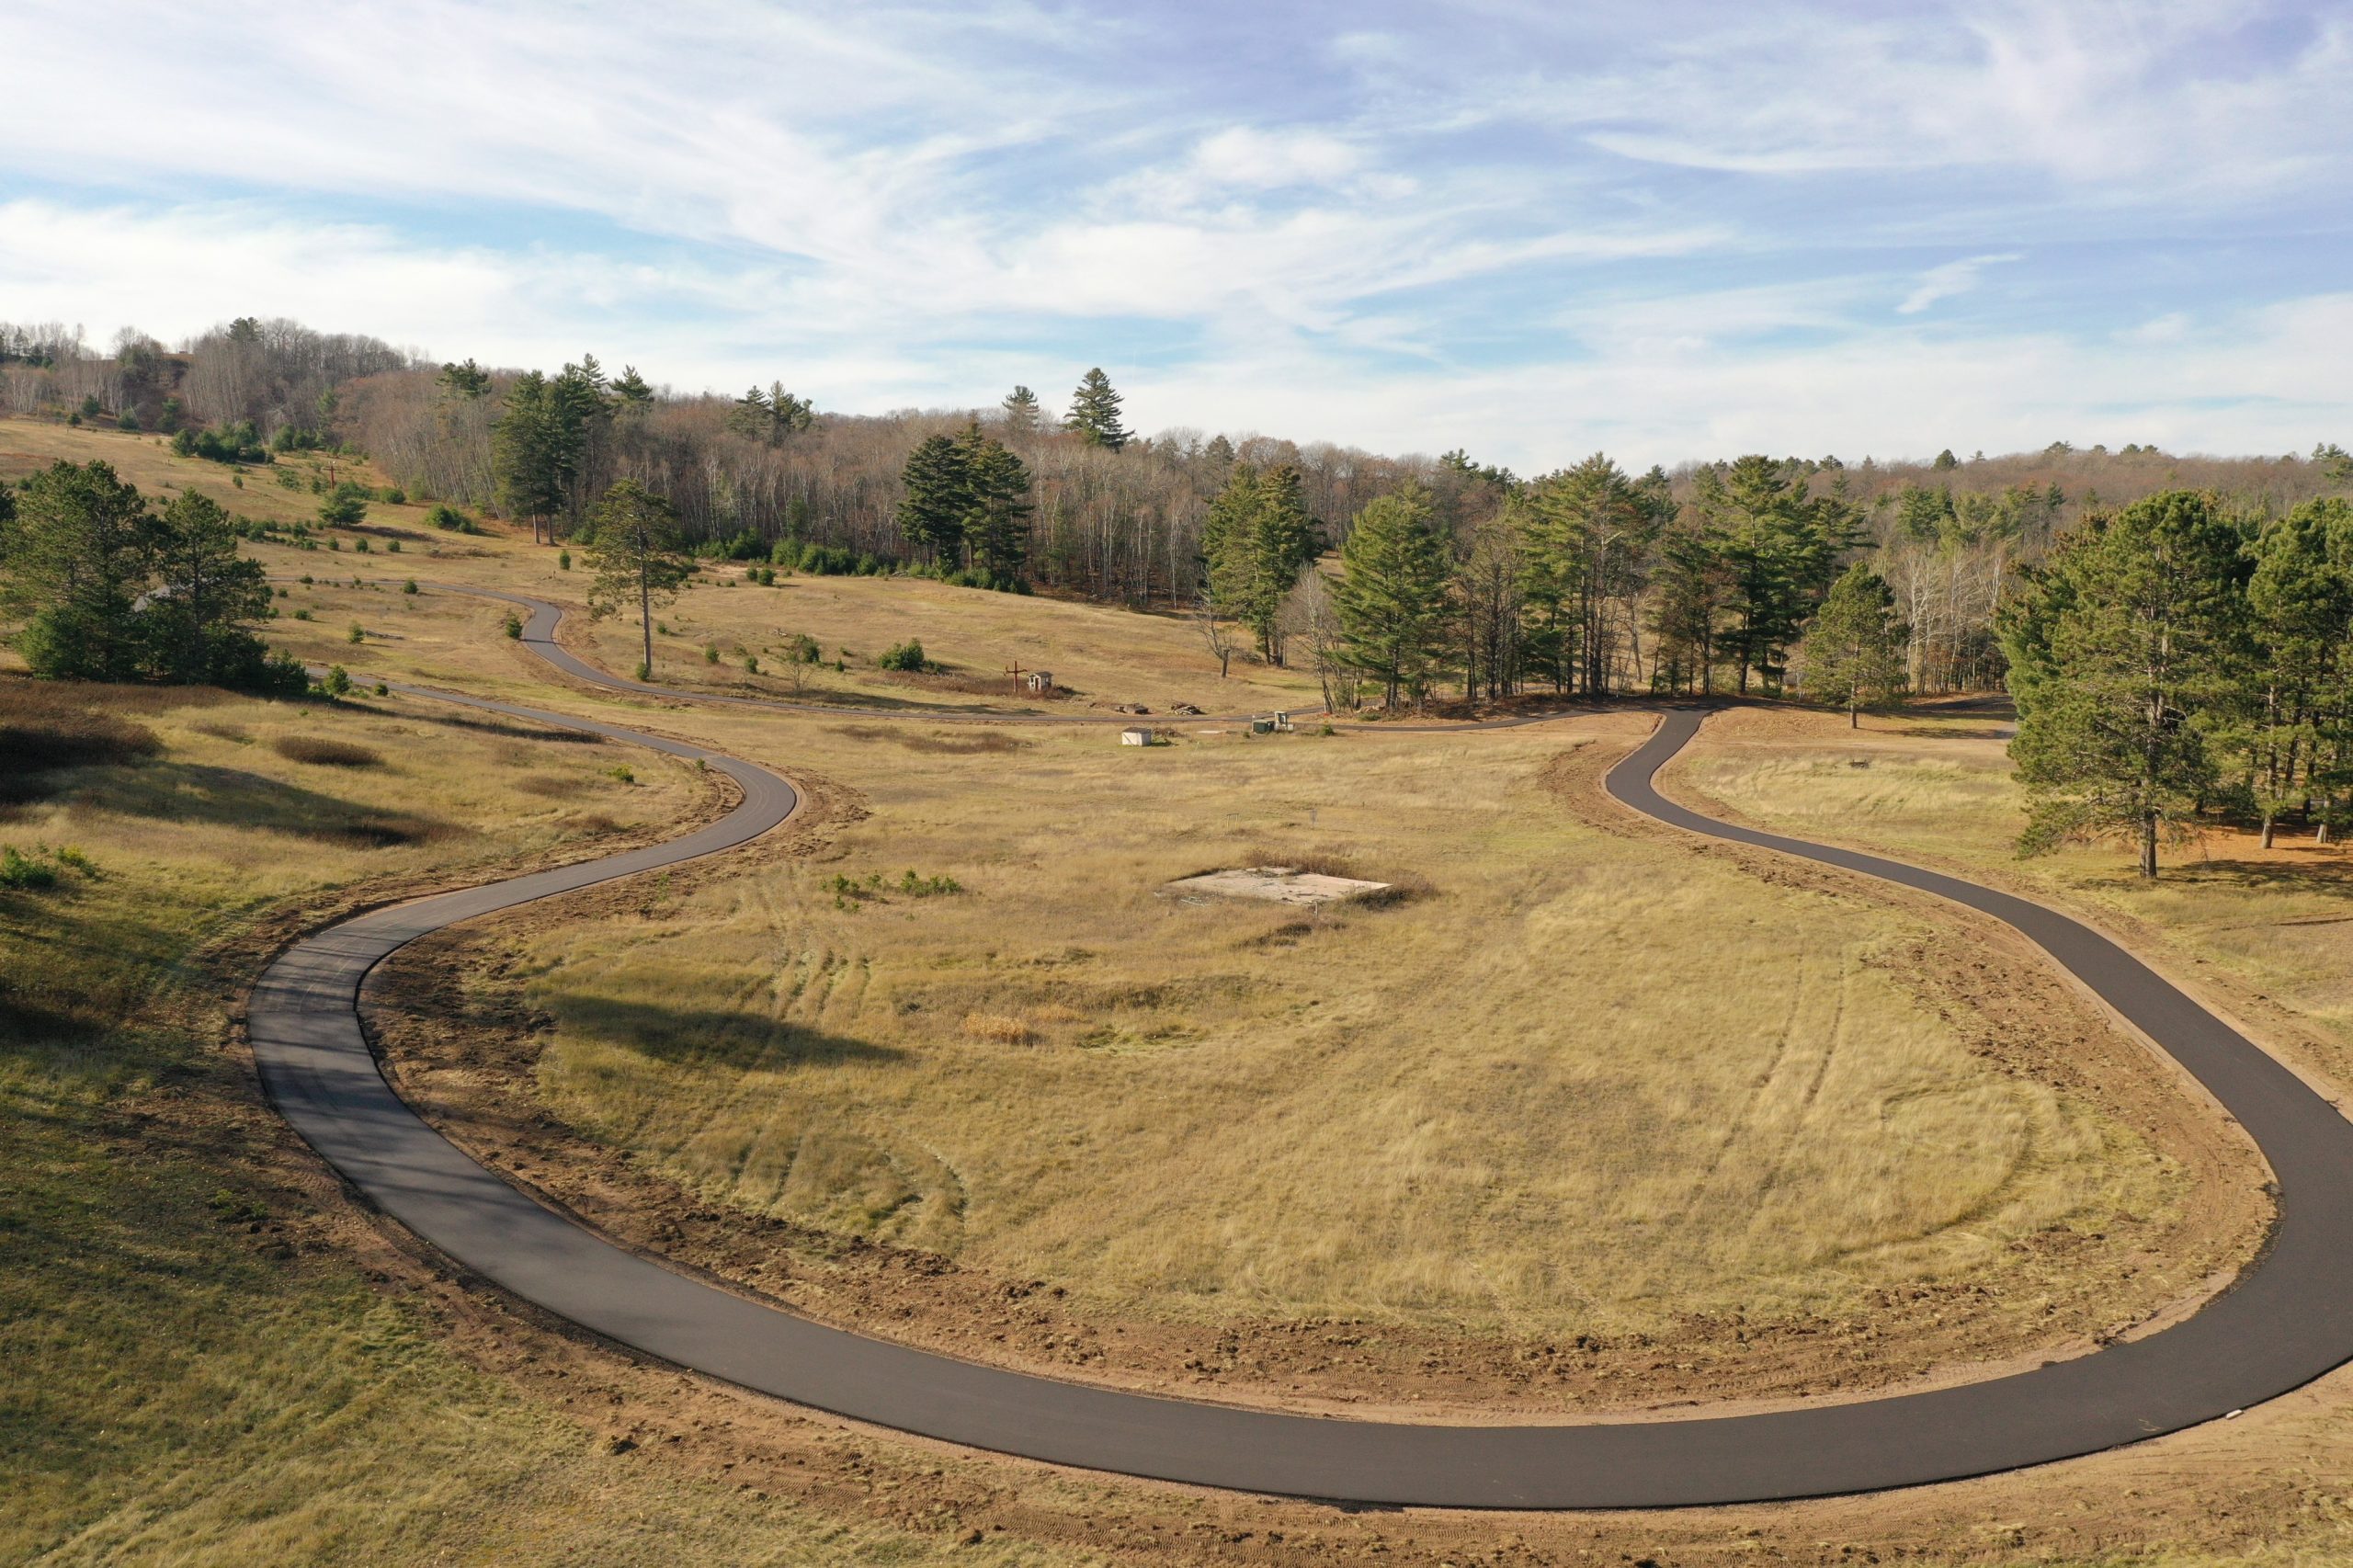
The 5-kilometer paved rollerski loop at the base of Mt. Telemark, outside Cable, Wisconsin, when it was laid in 2023. A fixed loop like this is all a Zone 1 check needs: 45 to 60 minutes of laps, with lactate and heart rate taken after each one. (Photo: American Birkebeiner Ski Foundation)
Checking Zone 1
To confirm the accuracy of Zone 1, I have athletes do 45 to 60 minutes of work on a standard loop of about 15 to 20 minutes, and we take lactate measurements after each loop. If lactate and heart rate remain stable, we know the endurance Zone 1 training is in the correct range. A stable lactate response suggests that the intensity is easy enough, but it does not necessarily identify the first lactate threshold, or LT1.
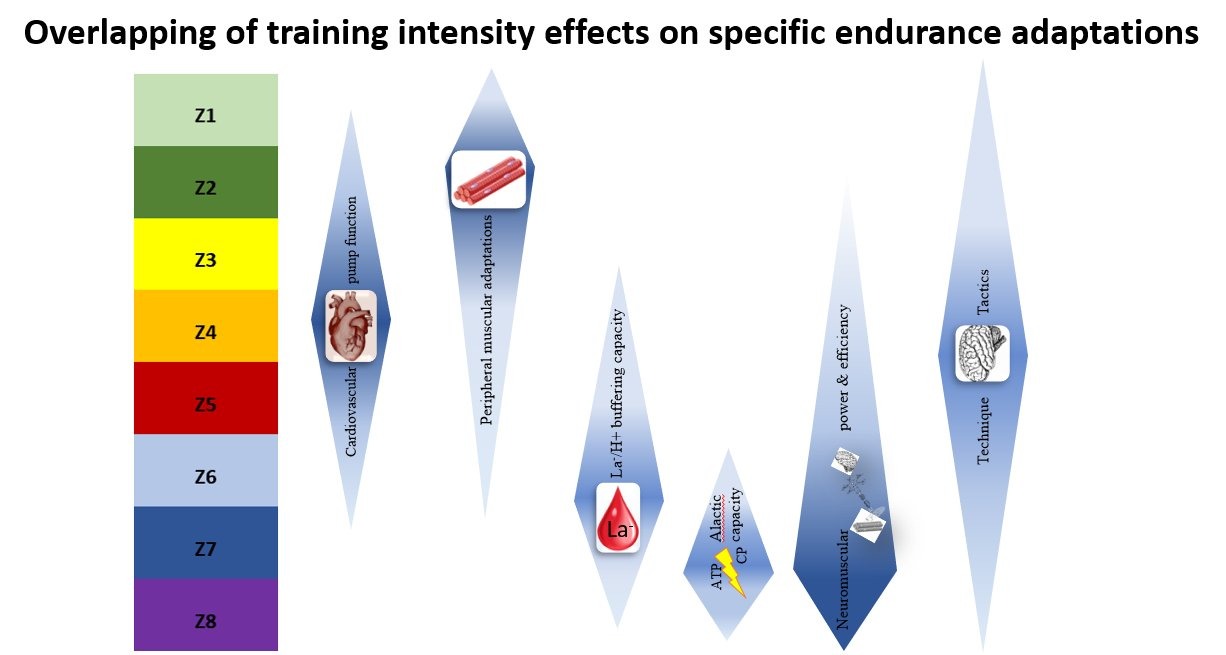
We need to understand that no method of determining training zones is precise. The body just doesn’t operate that way. For any training adaptation there is an optimal point of adaptation, but also a much broader range in which the adaptation occurs. So the objective when implementing training is to be as close to the optimal point as possible. But knowing where that is day in and day out is impossible, so being within a reasonable range is the goal.
Every adaptation has an intensity where it responds best and a much wider range where it still responds. (Figure: redrawn from Olympiatoppen educational material, 2020)
Close Enough
My conclusion is that using field-testing measures along with training and race performance data to support training-zone determination is adequate, and it allows us to build ranges that can move as fitness changes. There are no ideal “thresholds” or clear metabolic points we can use to determine training zones. LT1 and the second lactate threshold, LT2, are useful reference points, but different protocols and definitions can produce different estimates for the same athlete.
Other thresholds, determined by heart rate variability, DFA alpha1, respiration and muscle oxygen, may prove useful in the future, but so far they have not been fully validated and likewise cannot identify clear physiological thresholds.
So we are left with what is practical and available to developing and recreational athletes. Let’s get close enough, control training effectively and learn what works based on the data for each athlete. Heart-rate metrics fit that need best.
We can debate exactly where one training zone ends and another begins, but no test gives us a number that will describe an athlete perfectly every day. For the athletes I coach, heart rate gives us a practical place to start and a way to follow their response over time. I use field tests and race results to establish working ranges, then look at heart rate alongside pace, perceived effort, conditions and, when available, lactate. If those observations no longer agree, I revisit the zones.
The goal is not to defend a particular method or number on a chart. It is to help an athlete do the work as intended on a given day, learn from the response and make a better decision the next time. That is where training zones earn their value.
Help Support Our Coverage!
If you value the thoughtful work and access FasterSkier provides, please consider becoming a Voluntary Subscriber. Your support directly fuels our work to cover the people, places, and moments that make our sport special.
Canadian biathletes Brendan Green and Scott Perras rollerskiing up Guardsman Pass above Park City, Utah, during a fall 2015 camp. (Photo: Matthias Ahrens)
Coach, competitor, correspondent, commentator—Jim Galanes has spent a lifetime on cross country skis, always serving as a keen observer of our sport. A three-time Olympian in both Cross-Country and Nordic Combined, Jim has tested the theories, initiated the instruction, assessed the results. Now, FasterSkier is thrilled to announce that Jim joins our staff of writers and contributors, adding his unique and time-tested insights to the editorial offerings of this publication.






Comments
Commenting policyJoin the conversation. Comment and react with your Endurance ID — one account across the whole network.
Loading comments…