Adam, over at NordicXplained, asks:
“Everyone knows how well the Canadian men’s team did at the Olympics, but the question that I wanna know is how well they stacked up against other countries. Even though they didn’t win a medal, their average placing in many races surely could have been higher than traditional powerhouses like Russia and even Norway in the opening 15km classic.”
Can do!
A few cautionary comments before we get going. At the Olympics, each nation can only start four people in any given race. So comparing team performances using only summary statistics may be dangerous here. We’d be averaging four values! It’s easy to get sucked into trying to invent some arcane numerical summary to “fix” this problem, but usually it’s just best to plot the data and look at it. The answer is often fairly clear without having to do any fancy math.
Adam’s question deals with team performance, so that’s what I’ll look at. That means that as I evaluate the data, I’m going to consider every result, top to bottom, for each nation. What counts here is the performance of the “group”. Socialism! Yay!
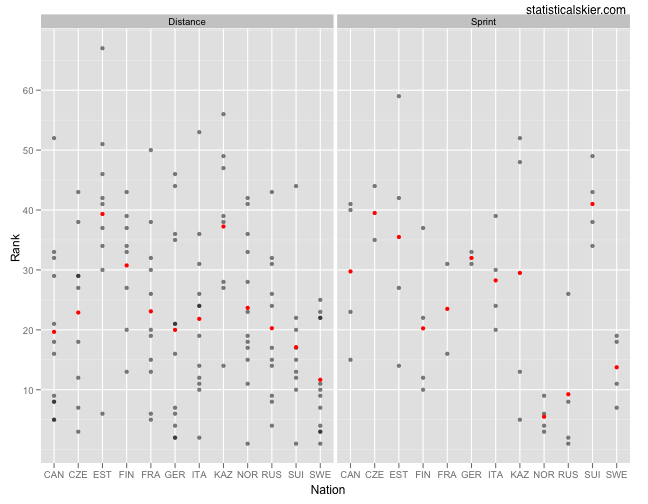
Let’s start by looking just at what place people came in, for the traditionalists out there:
Each (non-red) dot represents a result by an individual skier. Darker dots mean that there are two dots being plotted over each other. The red dots are the mean for each nation. There were three individual distance races and one sprint race. We can dispense with the sprint race right off the bat. The Canadian men aren’t (to my knowledge) known to excel in sprinting, and this bears that out. Norway and Russia pretty much owned that event.
On the distance side of things, there is a clear winner, and it is Sweden. Their average result was fully 5-6 places better than the next country (Switzerland) and their worst result was only 25th or so. Picking a second place country gets a bit muddier. Switzerland would be the obvious choice, except that Germany had more top ten results (7 vs. 2). On the other hand, Germany had more results worse than 25th (4 vs. 1). And of course, we have the reason for this post, the Canadians, nipping at both their heels.
Using my arbitrary discretion wand, I’d call it this way:
- Sweden
- Germany
- Switzerland
- Tie: Canada and Russia
- Tie: Norway, Italy, France and Czech
Recall that I’m not really giving much in the way of special bonus points for having one skier who lands on the podium. I’m trying to judge the performance of every skier on each team. And obviously there’s a lot of judgement at play. For instance, I gave Germany a little extra credit for the number and quality of their top 10 results (7 of them, and better on average than Canada’s 7 top ten results). Feel free to debate amongst yourselves in the comments.
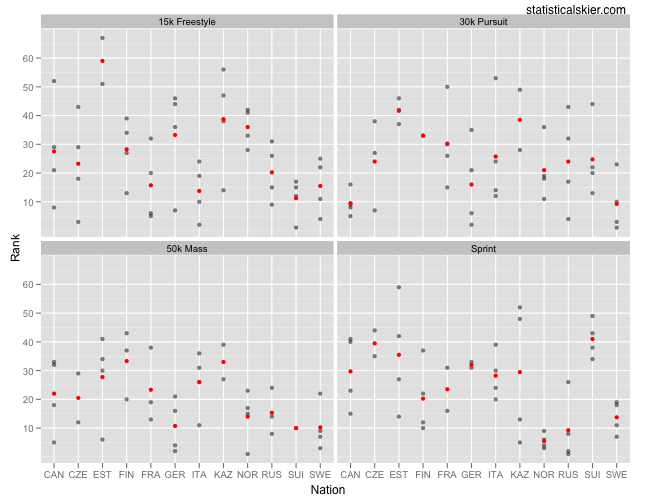
Let’s break this down by each individual race:
Not surprisingly, we see that Canada had a spectacular race in the 30k Pursuit (as a team, anyway). I should also point out that Canada’s one bad result in the 15k was Gordon Jewett’s only individual race of the Olympics. I hate to pick on specific skiers, but there’s the possibility that if Devon Kershaw had started in place of Jewett in the 15k, the Canadian men might not have had a single distance result over 35th. This isn’t a knock on Jewett. Rather, we should interpret it as an indicator of just how impressively Kershaw, Harvey, Grey and Babikov skied at the Olympics this year. Those four guys were just feeling it.
I should mention that Norway, a typical powerhouse, had a truly abysmal Olympics in the distance events. Petter Northug won the 50k, obviously, but other than that they didn’t have a ton of success. Certainly not to the extent they are used to. So outclassing the Norwegians as a team this year should come with something of an asterisk. Still, credit is due to those who show up and race fast.
Finally, I’ll provide the equivalent graphs using FIS points, which tell roughly the same story. I’ve gone the “fancy” route here and adjusted the FIS points. Basically, that means that the 30k and 50k points have been scaled to be more comparable to interval start points. You can read up on how this works in more detail here.
Related posts:
- <Skiing Performance and Age
- <Trends In US Skiing Performance: Distance
- <Trends In US Skiing Performance: Sprint


