Previously, I described some problems with using percent back (PB) as a basis for comparing race performances. Namely, mass start and interval start races produce very different types of PB’s. In this post we’ll briefly consider whether this problem is actually worth worrying about and then I’ll finish with a simple solution.
At first glance, the discrepancy between mass and interval start races seems awfully dramatic, and it is. However, there is some reason to think that we shouldn’t worry about it, at least in some specific circumstances.
This discrepancy will only produce systematic advantages for some athletes over others if the skiers are choosing to race only mass or interval start races. If everyone has the same opportunity to ski in races that lead to better PB’s, we might not need to worry. Specifically, for the purposes of averaging large numbers of results from multiple races and then using these averages to rank athletes, we shouldn’t worry.
This argument only works well where you have a relatively stable set of athletes competing week in and week out. To some extent, this is true on the World Cup circuit, at least for the top skiers. There is quite a bit of churn at the bottom I imagine. Keep in mind, though, that slower athletes will tend to have their FIS points inflated by the current rules if they do a mass start race, so it might actually be advantageous for these skiers to pick interval start races if they’re only getting a handful of starts.
What does break down is the ability to compare two isolated results, either for a single athlete or between two different athletes.
These are subtle differences, so I’m going to summarize them as clearly as I can: differences between mass and interval start races probably have
- limited impact on relative measures of athlete performance using averages from many different races (assuming everyone is doing roughly the same number of mass and interval start races). If you’re averaging multiple FIS point results to compare athletes, nations etc., you’re probably ok.
- a significant impact on our ability to compare two particular results from specific races. If you take two specific results from different races, we may have a difficult time interpreting which represents a “better” result.
Finally, there is the question of what sort of impact this has on comparing FIS points between international and domestic races. This leads us into territory I want to avoid, as it raises the issue of whether race penalties accurately capture the strength of a field. I’ll leave that question for another day.
Now, assuming we want to fix this problem, can we think of something better than F-factors? If you’ve ever gone to school, in almost any capacity, you’ve probably encountered the most obvious solutions: grading on a curve.
The procedure is simple. We pick a reference distribution that we’d like to peg our results to. We can choose anything we want. In grading, usually people pick a bell curve. That doesn’t make much sense in this case. Instead, we can simply use the distribution of interval start PB’s. I don’t even really need to check whether the resulting distributions will be the same, because, by definition, what I’ve done is to make them the same.
Here’s the sequence of steps in gory detail:
- Convert a mass start PB to a percentile (i.e. it’s better than 98% of all mass start PB’s)
- Find the equivalent percentile for interval start races (i.e. 98% of interval start PB’s are above, say, 0.015)
- This is my converted PB value: 0.015!
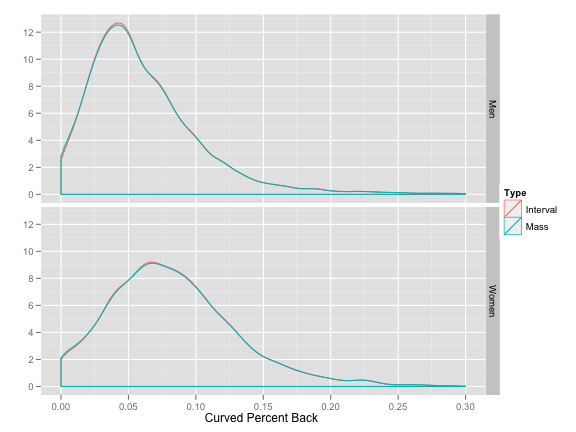
That’s it. I said I don’t even need to check whether the resulting distributions are the same, but in case you don’t believe me:

You can just barely make out the red interval start line peaking out from behind the mass start line. Like I said, this procedure, by definition, creates identical distributions of PB’s. Now to convert these PB’s to what we’re familiar with as FIS points we can simply multiply them all by 800. Easy as pie.
Since I’m a baseball fan, I’ll use a fancy sounding Sabermetric-ish acronym for this EqPB (Equivalent Percent Back).
The next interesting thing to do is to look at the results for particular athletes, or groups of athletes and see if using EqPB causes any big changes to see if I was right about when we should and should not worry about these differences…

